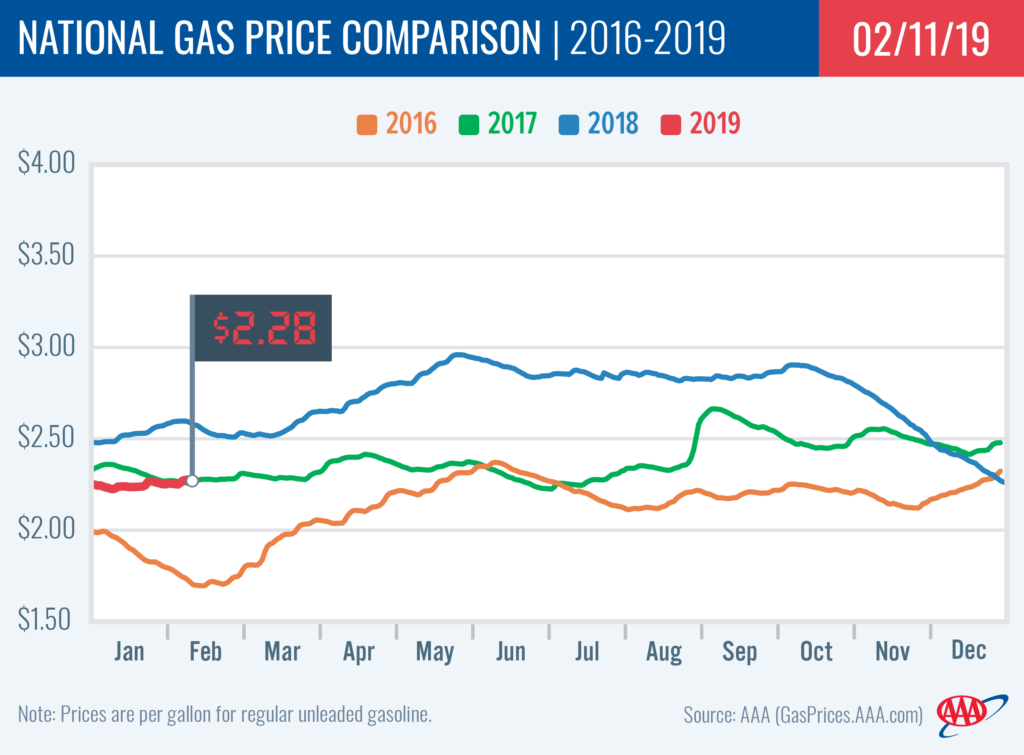
On the week, the national gas price average is two cents more expensive, landing at $2.28. At the start of the workweek, nearly half of all state averages also saw jumps – some at or more than a dime increase.
Frigid temperatures across much of the country have contributed toward a half a million barrel per day drop in demand to measure at 9 million bbl – a level consistent with a year ago according to Energy Information Administration (EIA). At the same time, gasoline stocks saw a nominal 513,000 bbl increase for a total of 257.8 bbl. While demand is mostly flat year-over-year, total stocks sit at a 124 million bbl surplus.
“Since the beginning of the year, crude oil remains relatively cheap, moving between $51- $55/bbl,” said Jeanette Casselano, AAA spokesperson. “This, coupled with fluctuating gasoline stocks due to planned and unplanned maintenance at refineries as well as instability in demand, likely due to frigid temperatures, are all contributing toward movement at retail pumps across the country.”
Today’s national gas price average is four cents more expensive than a month ago and 30 cents less expensive than a year ago.
Quick Stats
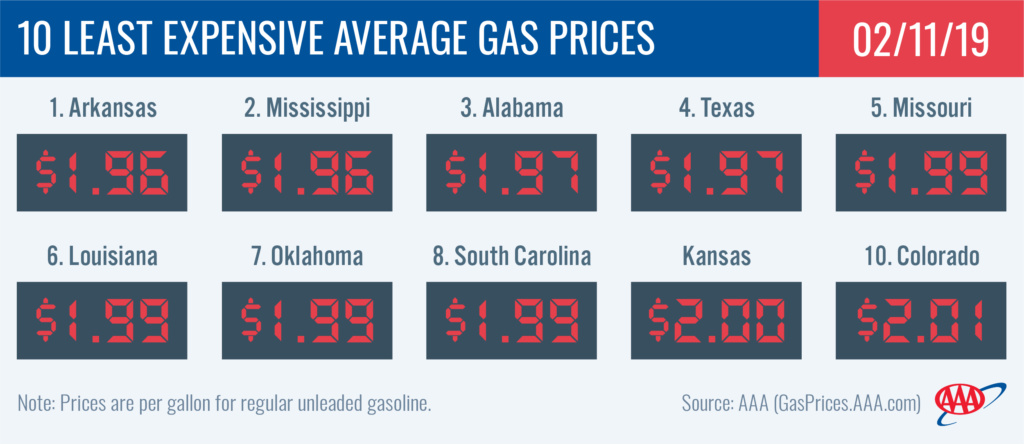
- The nation’s top 10 least expensive markets are: Arkansas ($1.96), Mississippi ($1.96), Alabama ($1.97), Texas ($1.97), Missouri ($1.99), Louisiana ($1.99), Oklahoma ($1.99), South Carolina ($1.99), Kansas ($2.00) and Colorado ($2.01).
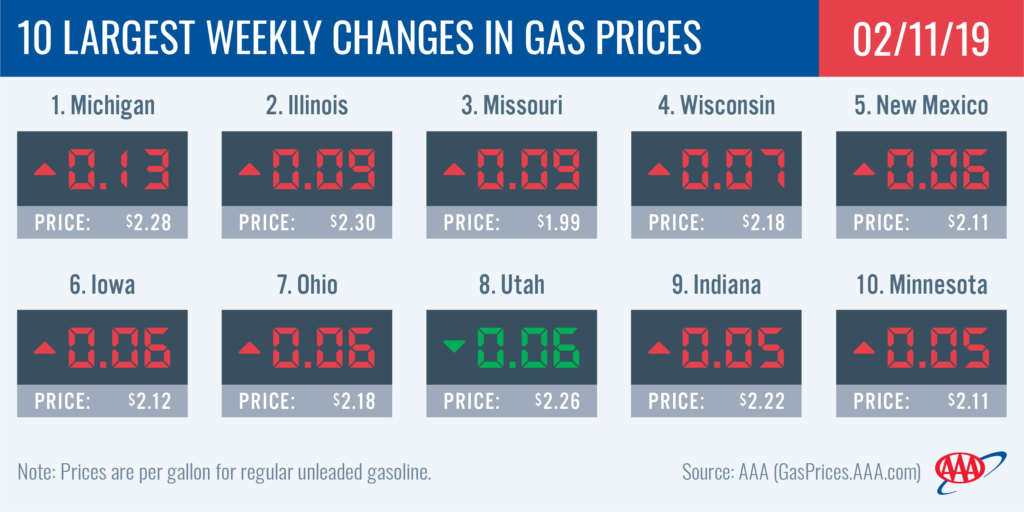
- The nation’s top 10 largest weekly changes are: Michigan (+13 cents), Illinois (+9 cents), Missouri (+9 cents), Wisconsin (+7 cents), New Mexico (+6 cents), Iowa (+6 cents), Ohio (+6 cents), Utah (-6 cents), Indiana (+5 cents) and Minnesota (+5 cents).
Great Lakes and Central
The majority of Great Lakes and Central states’ motorists are paying more to fill up at the pump on the week. Eight of the country’s top 10 states with the largest weekly increases are from this region with prices increasing a nickel or more since last Monday: Michigan (+13 cents), Illinois (+9 cents), Missouri (+9 cents), Wisconsin (+7 cents), Iowa (+6 cents), Ohio (+6 cents), Indiana (+5 cents) and Minnesota (+5 cents). Nebraska and Kansas state averages also jumped by six cents.
Winter weather is one reason for the region’s fluctuating gas prices. Frigid weather has caused unplanned maintenance at a handful of refineries. This includes, according to the OPIS Refinery Maintenance Report: BP Whiting (Indiana); CITGO Lemont (Illinois); Phillips 66/Cenovus Wood River (Illinois) and Marathon Petroleum (Michigan). These disruptions negatively impacted utilization rate, down two percent, and limited stock growth.
On the week, stocks built by only 350,000 bbl on the week, per the latest EIA data published. At 61.8 million bbl, regional gasoline stocks sit at their highest level in a year. The small jump in stocks, coupled with healthy stock levels, is helping most of the region see lower pump price increases – under double-digits. If stocks make strong gains in the week ahead, gas prices could see less fluctuation.
South and Southeast
Gas prices range between $2.24 (Florida) and $1.96 (Arkansas) in the South and Southeast region with averages as much as six cents more expensive and four cents cheaper on the week. New Mexico (+6 cents) and Oklahoma (+5 cents) saw the largest jumps, while Florida (-4 cents) is cheaper after a period of increases. Refinery maintenance and exports are impacting gas prices in the region.
According to EIA data, exports jumped by nearly 300,000 b/d to 895,000 b/d, contributing towards regional stocks dipping by 1.8 million for the week ending February 1. At the beginning of the year, stocks sat at 89.3 million bbl. With the latest draw, the region’s total stocks sit at 84.8 million bbl. This is the third straight week of stock declines as utilization holds relatively stable at 90 percent.
Mid-Atlantic and Northeast
Only three Mid-Atlantic and Northeast states have more expensive gas price averages on the week: West Virginia (+3 cents), Pennsylvania (+2 cents) and Tennessee (+1 cent). The rest of the region is paying less to fill-up as compared to last Monday. These states all saw the largest drop of three cents: Rhode Island, Vermont, Connecticut, Massachusetts and Washington, D.C. Despite the drop, Washington, D.C. ($2.50) carries the most expensive average in the region while Tennessee is the cheapest at $2.04.
With regional utilization up 2.2 percent to 74.6 and an increase in imports, the region’s gasoline stocks built by 2.3 million bbl for the week ending February 1 – the largest of any region according to EIA data. Total stocks register at 71.3 million bbl, which is a number not seen in the region since early 2017, and should help keep fluctuation in gas prices relatively moderate.
Rockies
Utah (-6 cents), Wyoming (-4 cents) and Idaho (-4 cents) have among the largest weekly declines in the country on the week. State gas price averages are also cheaper in Idaho (-3 cents). While Montana ($2.25) holds flat on the week, Colorado’s ($2.01) gas price average is down a penny and the state continues to rank as the 10th least expensive average in the entire country.
Total gasoline stocks for the Rockies region held flat at the 7.3 million bbl mark for the week ending Feb. 1, according to EIA’s latest report.
West Coast
Pump prices in the West Coast region are among the highest in the nation, with all of the region’s states landing on the nation’s top 10 most expensive list. At $3.26, California and Hawaii are the most expensive markets. Washington ($2.87), Nevada ($2.85), Alaska ($2.82), Oregon ($2.76) and Arizona ($2.45) follow. Prices have been volatile on the week in the region, with Alaska seeing the largest drop (-3 cents) and California seeing the largest increase (+2 cents).
EIA’s recent weekly report showed that West Coast gasoline stocks decreased slightly by approximately 200,000 bbl to 32.6 million bbl. Stocks are approximately 2.4 million bbl lower than at this time last year, which could cause prices to spike if there is a supply challenge in the region this week.
Oil market dynamics
At the close of Friday’s formal trading session on the NYMEX, WTI increased eight cents to settle at $52.72. Oil prices were volatile last week, following the release of new data from EIA that showed that at the end of the previous week, total domestic crude oil inventories rose less than expected – a build of only 1.3 million bbl to total 447.2 million bbl. For market observers, the price gains indicate that the global crude supply is tightening, an anticipated result of U.S.-imposed sanctions on Iran’s crude exports and OPEC’s production reduction agreement of 1.2 million b/d with other non-OPEC producers, including Russia. The reduction agreement remains in effect for the first six months of 2019.
Additionally, the global crude supply is expected to tighten as a result of U.S.-imposed sanctions on crude exports from Venezuela, which could send crude prices higher. Moving into this week, global crude prices will likely remain volatile as the market also looks for indications that the trade tensions between China and the U.S. are heading toward resolution, reducing fears of lowered crude demand as a result of continued escalation of the dispute.
In related news, Baker Hughes Inc. reported that the U.S. added seven oil rigs last week, bringing the total to 854. When compared to last year at this time, there are 63 more rigs this year.
Motorists can find current gas prices along their route with the free AAA Mobile app for iPhone, iPad and Android. The app can also be used to map a route, find discounts, book a hotel and access AAA roadside assistance. Learn more at AAA.com/mobile.


