The New Year has ushered in the cheapest national gas price average in three years. To boot, at $2.25 today’s national average is even one cent cheaper than on January 1 and trends indicate that pump prices will likely remain cheap for at least the first half of the month.
| Gas Price Averages: Jan 1-3 | |||
| 2016 | 2017 | 2018 | 2019 |
| $1.99 | $2.35 | $2.49 | $2.25 |
Today, 29 state gas price averages are at or below the national average of $2.25 with Missouri touting the cheapest at $1.83. Hawaii ($3.34) carries the most expensive average.
“With OPEC production cuts slated to take effect this week, analysts will closely be watching the price of oil,” said Jeanette Casselano, AAA spokesperson. “Significant movement toward higher market prices would mean cheaper gas prices could be in the rearview mirror. However, AAA expects to see minimal volatility at the start of the cartel’s production cuts.”
The end of 2018 drove WTI crude oil prices to as low as $44/bbl, which is a steep $31 drop from the high of $77/bbl seen during June.
Quick Stats
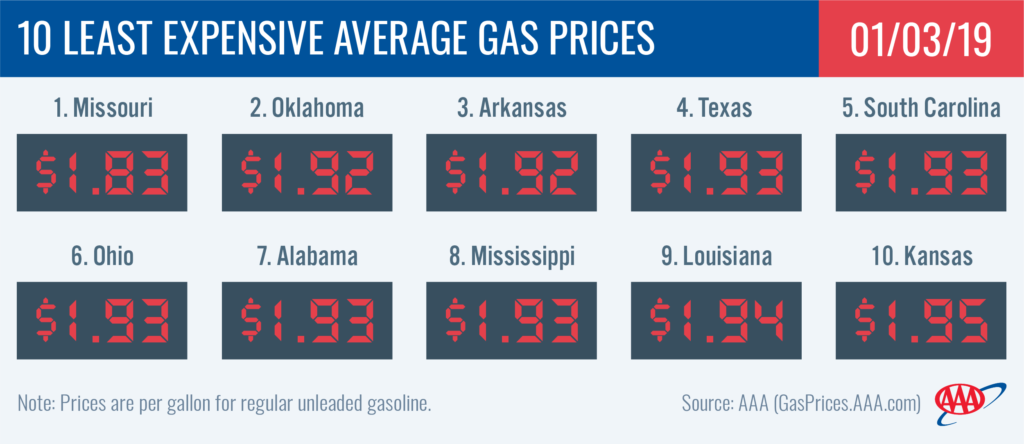
- The nation’s top 10 least expensive markets are: Missouri ($1.83), Oklahoma ($1.92), Arkansas ($1.92), Texas ($1.93), South Carolina ($1.93), Ohio ($1.93), Alabama ($1.93), Mississippi ($1.93), Louisiana ($1.94) and Kansas ($1.95).
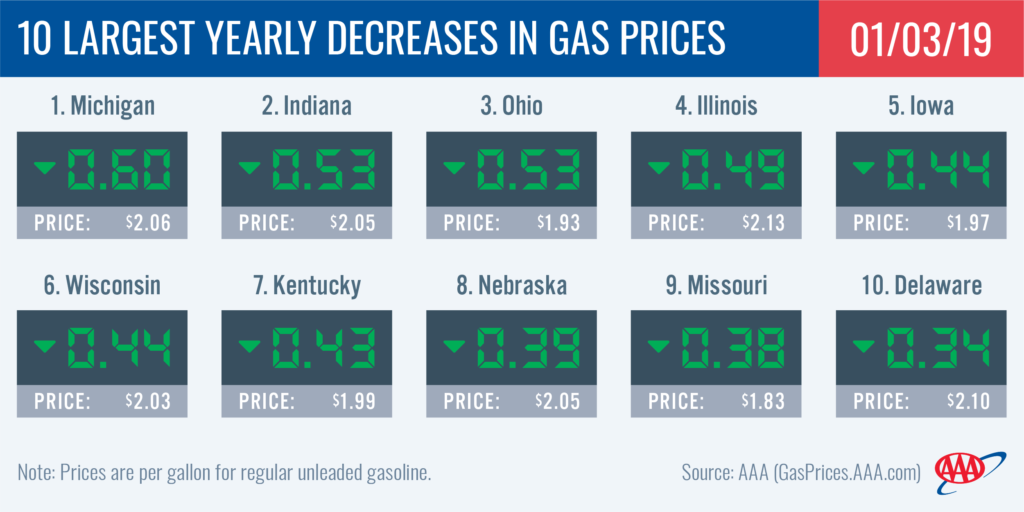
- The nation’s top 10 largest yearly decreases are: Michigan (-60 cents), Indiana (-53 cents), Ohio (-53 cents), Illinois (-49 cents), Iowa (-44 cents), Wisconsin (-44 cents), Kentucky (-43 cents), Nebraska (-39 cents), Missouri (-38 cents) and Delaware (-34 cents).

Great Lakes and Central
During the past 10 days, gas prices have dropped by at least a dime in four Great Lakes and Central states: Indiana (-15 cents), Ohio (-14 cents), Illinois (-11 cents) and Kentucky (-10 cents). With a nickel decline, North Dakota ($2.23) has seen the smallest drop during the 10-day period.
As gas prices decline, gasoline inventories in the Midwest region jumped for the fifth straight week, according to the Energy Information Administration (EIA). Total stocks for the week ending on December 21 total 53 million bbl, the highest level of stocks for the region since early September.
South and Southeast
Gas prices in the South and Southeast remain among the cheapest in the country, but state averages are declining at a slower rate than most states. On the week, states in the region only saw gas prices drop four or five cents with Florida ($2.15) seeing the sole nickel decline.
Regional refineries are operating at 98 percent of utilization as stocks continue to build. The latest EIA report lists total South and Southeast stocks at 85.7 million bbl – the highest on record for 2018 and levels not seen since early March of last year.
Mid-Atlantic and Northeast
All Mid-Atlantic and Northeast states have cheaper gas prices compared to the beginning of 2018. Delaware has the largest year-over-year savings of 34 cents.
This week, state gas price averages in the region range from $2.61 to $1.99. New York touts the highest average while Tennessee lays claim to the cheapest. On the week, motorists saw pump prices decline between two and five cents.
On the week, stock levels held flat at 60 million bbl as did regional refinery utilization (83 percent).
Rockies
Utah, (+17 cents), Wyoming (+14 cents) and Idaho (+21 cents) are three of only nine states whose gas price averages are more expensive compared to January 2018. Conversely, Montana and Colorado’s averages are 20 and 18 cents less expensive, respectively, than a year ago.
Not surprisingly, gas prices in Utah ($2.58), Wyoming ($2.58) and Idaho ($2.55) are among the 15 most expensive in the country this week.
The EIA reports that gasoline stocks held steady at 7 million bbl for week ending December 21, which is comparable to stocks at this time last year.

West Coast
Pump prices in the West Coast region remain the highest in the nation, with all of the region’s states landing on the nation’s top 10 most expensive list. Hawaii ($3.34) is the nation’s most expensive market, followed by California ($3.34), Washington ($3.07), Alaska ($3.06), Oregon ($2.94), Nevada ($2.93) and Arizona ($2.65). While expensive, prices are decreasing, with all state averages moving lower on the week: Hawaii (-6 cents) and Washington (-6 cents) saw the largest drops. However, when compared to last year, most prices in the region are higher today, with Arizona (+34 cents), Nevada (+27 cents) and Washington (+16 cents) leading the way.
The EIA’s weekly petroleum status report, for the week ending on December 21, showed West Coast gasoline stocks decreased by approximately 500,000 bbl to 27.1 million bbl. Stocks are approximately 3.6 million bbl lower than at this time last year, which could cause prices to spike if there is a supply challenge in the region this week.
Oil market dynamics
At the close of Wednesday’s formal trading session on the NYMEX, WTI increased $1.13 to settle at $46.54. Oil prices mostly fell last week, as market observers continue to believe that the global crude market is over-supplied. Moreover, new concerns are growing of a potential economic slowdown in 2019 that could lead to a decline in global demand for crude. However, recent price gains in the market underscore how volatile the market is now, which could lead crude prices higher if global supply tightens amid robust demand for crude. For now, new reports indicate that the U.S., Russia and Iraq, the second largest producer in the Organization of the Petroleum Exporting Countries (OPEC), saw crude production and export increases in the final months of 2018, contributing to the falling price of crude.
In related news, according to the latest weekly petroleum status report from the EIA, total domestic crude inventories took a slight step back during the week of December 21. But even with a decline of approximately 40,000, at 441.4 million bbl, domestic crude inventories are approximately 10 million bbl higher when compared to a year ago. In the coming weeks, market observers will look for indications that OPEC’s global pact with large non-OPEC crude producers (including Russia) to reduce crude production by 1.2 million b/d for at least the first six months of 2019 will help reduce the growing global glut of crude. In turn, this could drive up crude oil prices and, subsequently, gas prices.
Motorists can find current gas prices along their route with the free AAA Mobile app for iPhone, iPad and Android. The app can also be used to map a route, find discounts, book a hotel and access AAA roadside assistance. Learn more at AAA.com/mobile.
