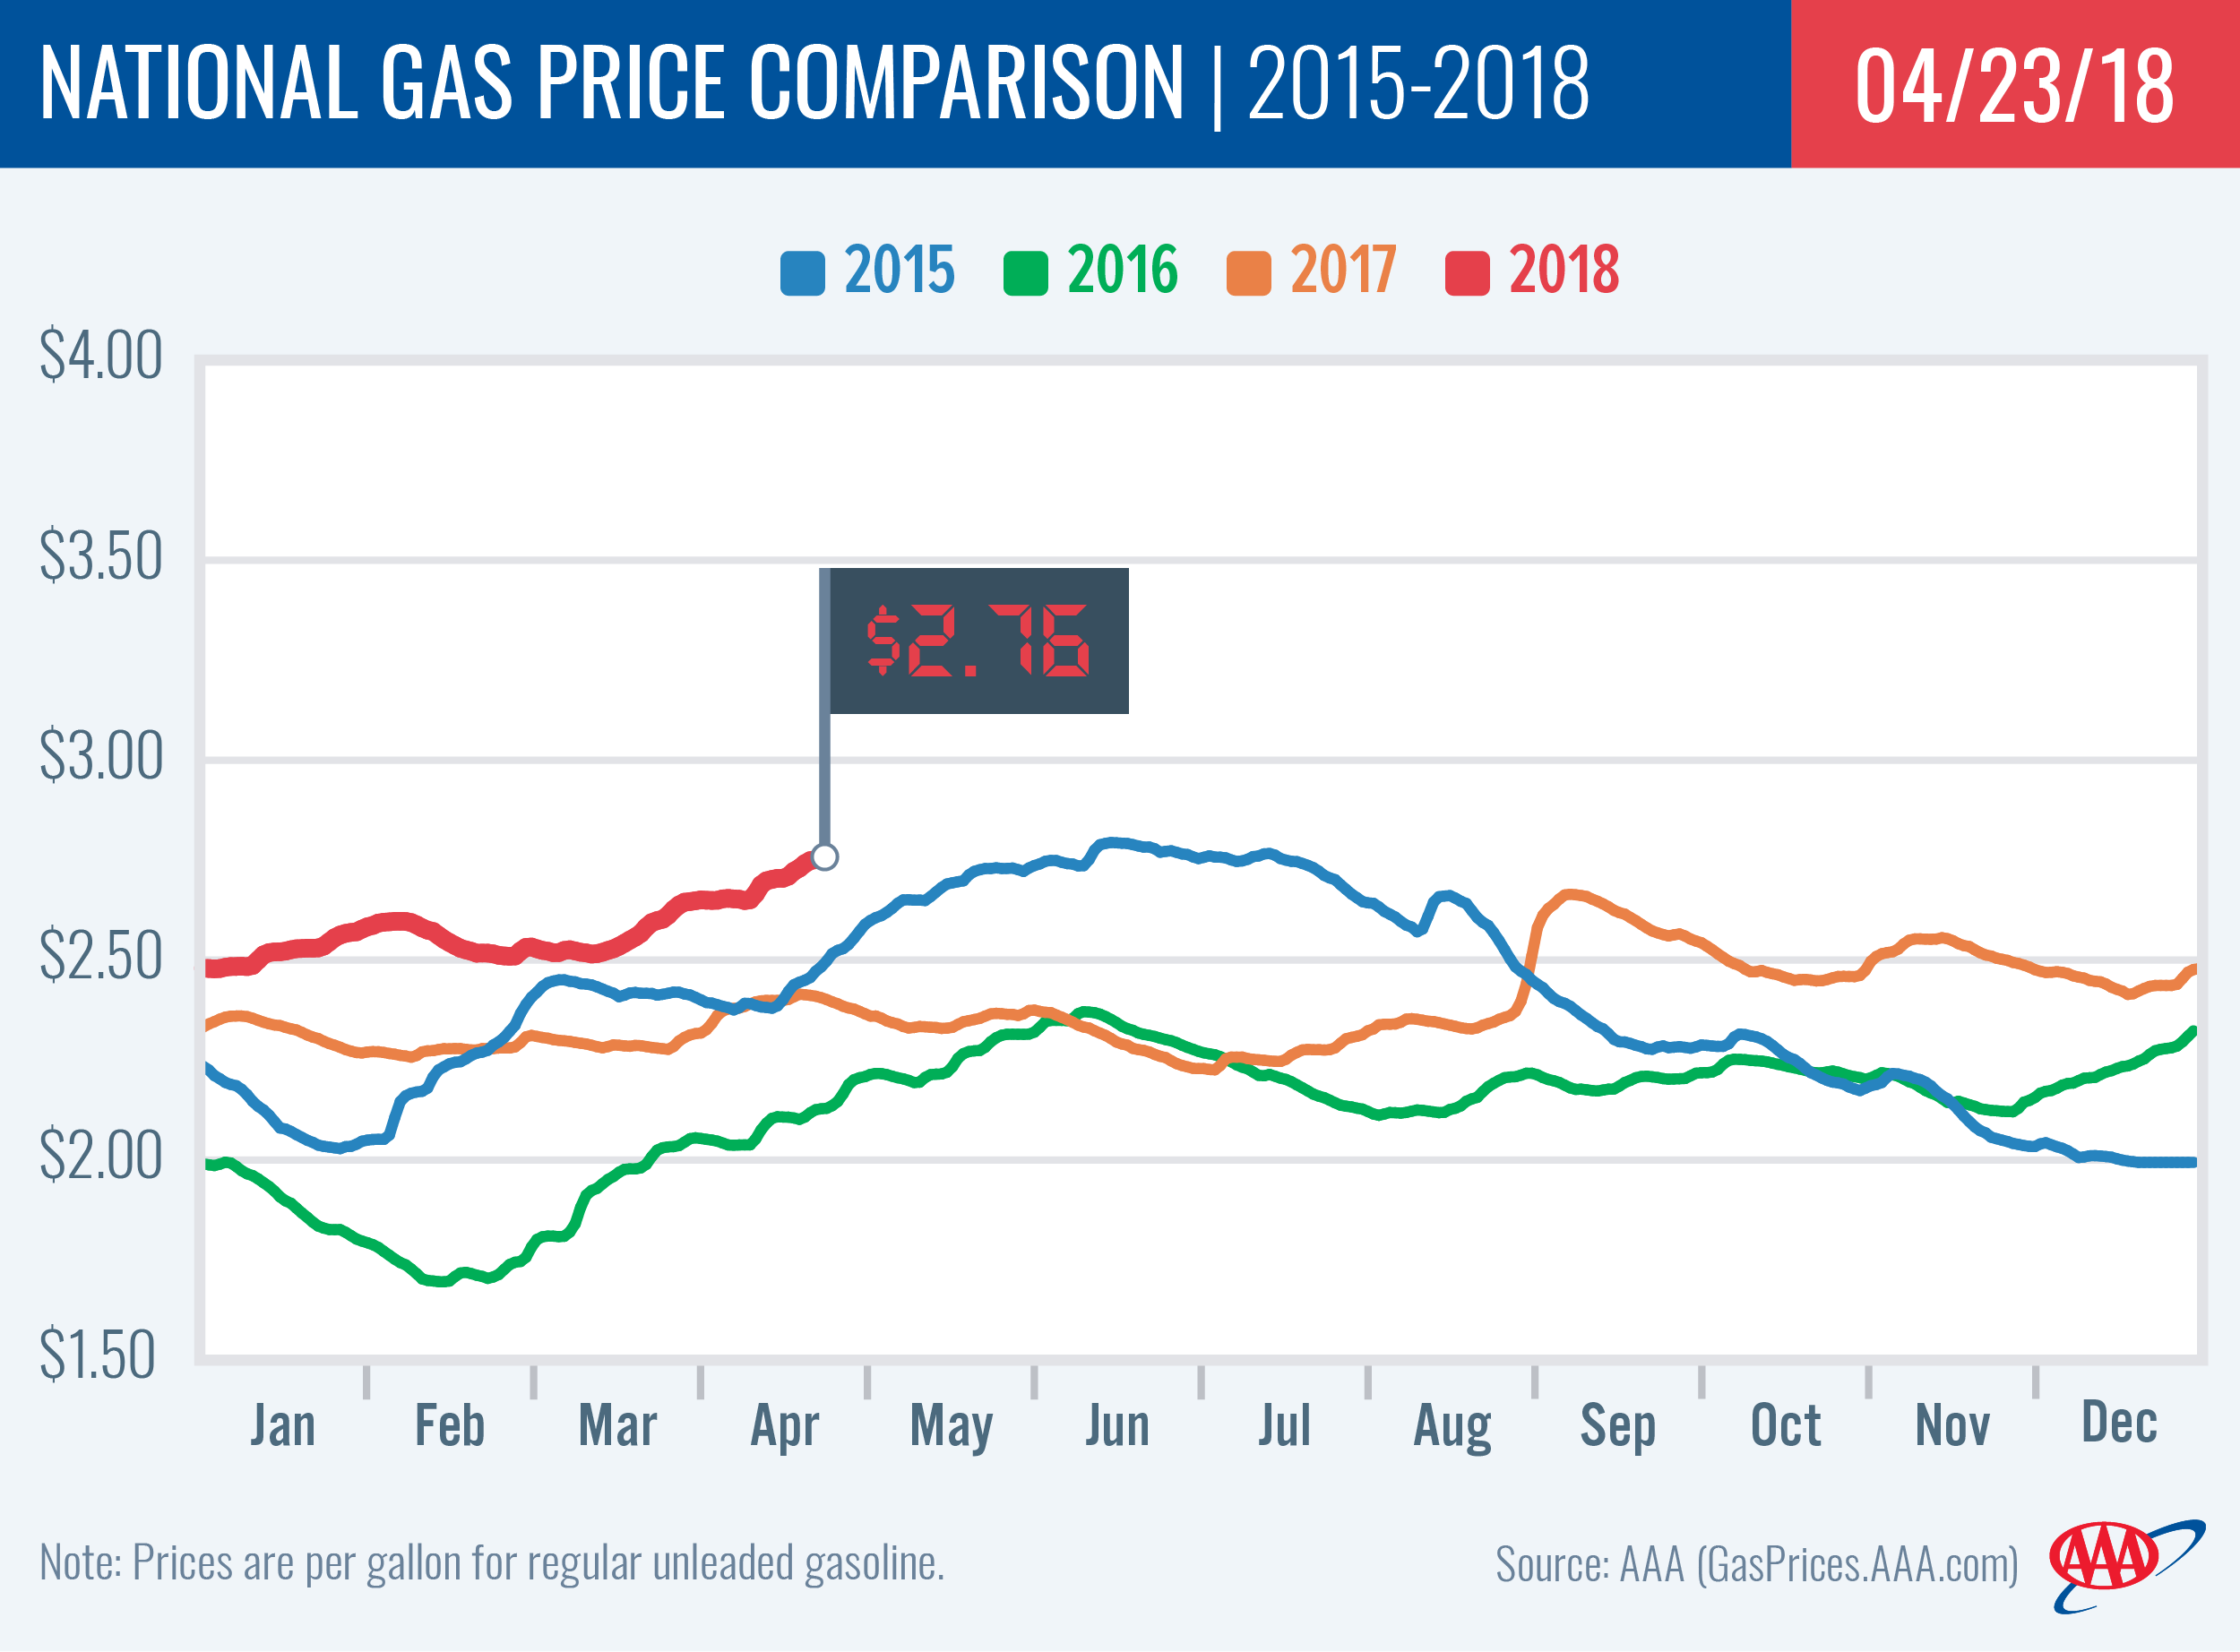
The Energy Information Administration’s (EIA) latest data registers consumer gasoline demand at 9.857 million b/d. That is the highest level ever on record for the month of April and exceeds typical summer demand measurements. As demand skyrockets, gas prices increased across the country on the week with five states seeing double-digit jumps. The national average ticked up a nickel to $2.76.
“Pump prices are causing sticker shock across the country,” said Jeanette Casselano, AAA spokesperson. “Gas is selling at $2.26 or more at every gas station in America. More so, 13 percent of stations have pump prices set at $3 or more.”
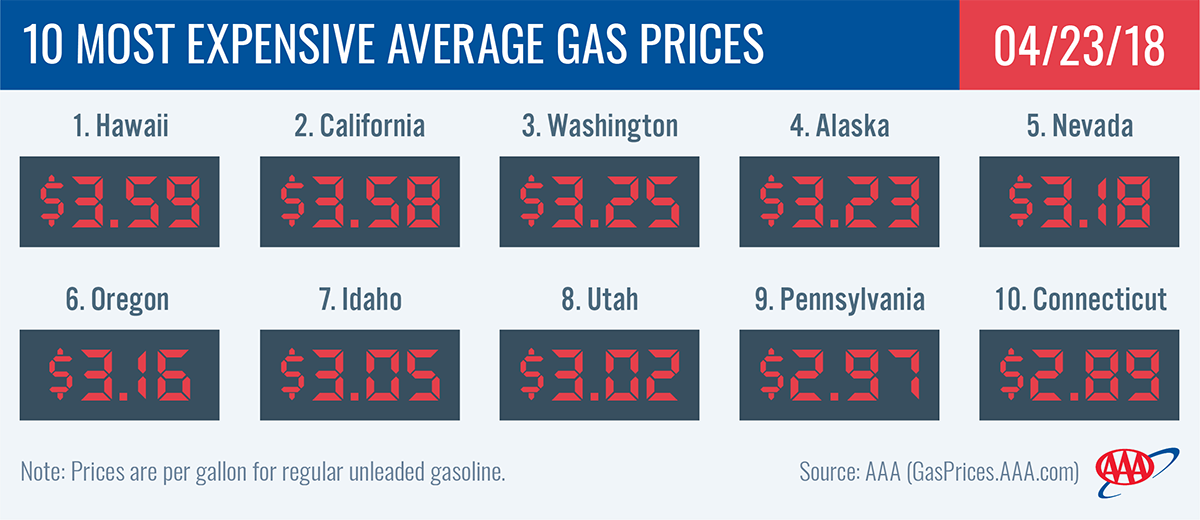
West Coast states primarily have the most expensive gas price averages ($3+). However, on the east coast, Pennsylvania ($2.97) is inching closer to that same threshold.
Today’s national gas price average ($2.76) is 17-cents more expensive than last month and 34-cents more expensive that last year at this time.
Quick Stats
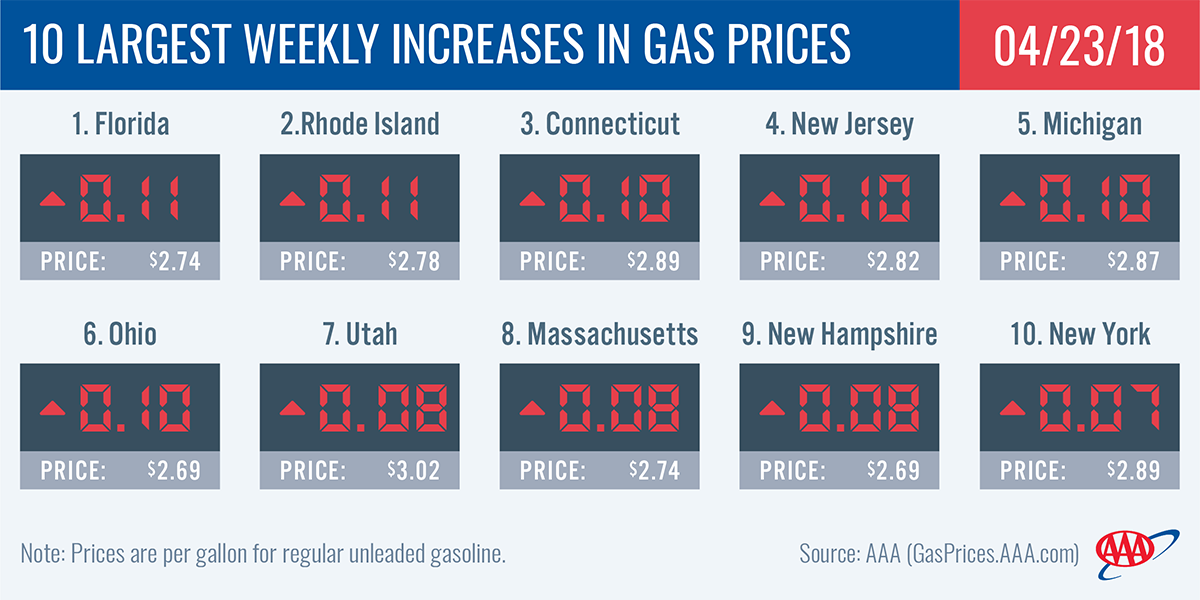
- The nation’s top 10 states with the largest weekly increases are: Florida (+11 cents), Rhode Island (+11 cents), Connecticut (+10 cents), New Jersey (+10 cents), Michigan (+10 cents), Ohio (+10 cents), Utah (+8 cents), Massachusetts (+8 cents), New Hampshire (+8 cents) and New York (+7 cents).
- The nation’s top 10 most expensive markets are: Hawaii ($3.59), California ($3.58), Washington ($3.25), Alaska ($3.23), Nevada ($3.18), Oregon ($3.16), Idaho ($3.05), Utah ($3.02), Pennsylvania ($2.97) and Connecticut ($2.89).
West Coast
Pump prices in the West Coast are among the most expensive in the country: Hawaii ($3.59), California ($3.58), Washington ($3.25), Alaska ($3.23), Nevada ($3.18), Oregon ($3.16) and Arizona ($2.79). On the week, all prices are up in each state. Arizona (+6 cents) and Nevada (+5 cents) lead the pack, while Hawaii and Oregon saw their averages for unleaded regular gasoline increase by two cents each.
The EIA’s latest report registers total gasoline inventories in the region down by 1 million bbl to 30.4 million bbl. This draw was the highest one-week decline in five weeks. West Coast gas stocks now sit 400,000 bbl higher than their level this time last year.
Great Lakes and Central
With this week’s increases, gas price averages in the region are as much as 35-cents more expensive than this time last year: Michigan (+35 cents), Indiana (+34 cents), Kentucky (+33 cents), Illinois (+33 cents) and Ohio (+30 cents). South Dakota (+22 cents) has the smallest year-over-year change in the region and the country.
On the week, Michigan and Ohio saw prices jump by a dime – the largest increases in gas price averages in the region and among the top 10 states in the country on the week. With a one-cent increase, Missouri saw the smallest increase in the region and the country. Overall, gas prices ranges from $2.87 in Michigan to $2.46 in Missouri.
Inventories remain above 57 million bbl, with the EIA reporting an 800,000 bbl decline on the week.
South and Southeast
With an 11-cent increase, Floridians ($2.74) are seeing not only the largest pump price jump in the country and among the South and Southeast states, but the most expensive price in the region. At $2.72, New Mexico has the second highest gas price average in the region followed by Georgia ($2.66). All other states in the region have an average of $2.56 or less.
On the week, all states saw prices increase, just not double-digits like Florida: New Mexico (+6 cents) Louisiana (+5 cent), South Carolina (+5 cents), Alabama (+5 cents), Mississippi (+4 cents), Texas (+4 cents), Arkansas (+4 cents), Oklahoma (+3 cents) and Georgia (+1 cent).
With a 680,000 bbl draw, gasoline inventories sit just above 81 million bbl, which is 2 million more than this time last year.
Mid-Atlantic and Northeast
Six Mid-Atlantic and Northeast states land on this week’s top 10 list with the largest increases with three of them seeing prices jump double-digits: Rhode Island (+11 cents), Connecticut (+10 cents), New Jersey (+10 cents), Massachusetts (+8 cents), New Hampshire (+8 cents) and New York (+7 cents).
Pennsylvania’s ($2.97) gas price average is trending to hit $3 potentially this week. However, it will likely be the only state in the region to reach this mark. Most other states are still 11-cents or more cheaper than Pennsylvania: Connecticut ($2.89), New York ($2.88), Washington, D.C. ($2.87) and New Jersey ($2.82)
After last week’s 3 million bbl add, this week the EIA reports the region drew 200,000 bbl. Inventories sit at 60 million bbl in total, more than 4 million bbl below levels in April of last year.
Rockies
For the first time since summer 2015, Idaho ($3.05) and Utah ($3.02) have seen gas prices exceed the $3 mark, landing both states on the top 10 list with the most expensive gas price average. This week, gas price increases varied across the region: Utah (+8 cents), Idaho (+6 cents), Montana (+4 cents), Wyoming (+3 cents) and Colorado (+2 cents). Even with the increase, Wyoming’s ($2.59) average is 46-cents cheaper than the most expensive state in the region.
For a third week, inventories declined but remain above the 7 million bbl level, according to the latest EIA data.
Oil market dynamics
At the close of Friday’s formal trading session on the NYMEX, WTI increased nine cents to settle at $68.38, which is the second highest close for WTI since Dec. 1, 2014.
The market saw increased volatility on Friday morning due to President Trump’s tweet that criticized OPEC’s efforts to restrict global crude supply and raise the price per barrel, but later in the day, crude prices rebounded to the highs they experienced earlier in the week. The jump in price per barrel occurred after Wednesday’s EIA weekly report revealed that crude inventories across the U.S. dropped by a combined 1.1 million bbl. They now sit at 427.6 million bbl – nearly 105 million bbl lower than their level in mid-April 2017. If EIA’s report this week reveals another inventory draw, crude prices are likely to continue climbing.
The year-over-year decline in oil inventories is a result of OPEC’s agreement with large non-OPEC producers to reduce crude production by 1.8 million b/d which was put into place inJanuary 2017. The agreement is supposed to remain in effect until the end of 2018. However, last week Russian Energy Minister Alexander Novak said that producers in the agreement may begin easing output curbs sooner because the agreement has cleared out the glut of crude that the producers aimed to reduce. Saudi Arabia, a leading member of the cartel, is likely to push back on any efforts to end the production reduction agreement prior to the end of the year because WTI prices could reach $80-$100 by that time. Representatives from both countries are likely to discuss the matter at OPEC’s upcoming meeting in Vienna, Austria on June 20 and 21.
In related news, Baker Hughes reported that the U.S. gained five active oil rigs last week, bringing the total to 820. The total is up 132 rigs when compared to the rig count at this time last year.
Motorists can find current gas prices along their route with the free AAA Mobile app for iPhone, iPad and Android. The app can also be used to map a route, find discounts, book a hotel and access AAA roadside assistance. Learn more at AAA.com/mobile.