Consumer gasoline demand is at the highest level on record for March. According to the Energy Information Administration’s (EIA) latest report, demand measured at 9.6 million b/d – levels typical of summer months, not the first quarter of a year. U.S. exports continue to trend high, accounting for a large chunk of this week’s demand data.
“As demand strengthened, gasoline inventories declined, pushing the national gas price average two cents more expensive on the week to $2.55,” said Jeanette Casselano, AAA spokesperson. “As a result, the majority of motorists are seeing more expensive gas prices at the start of this work week.”
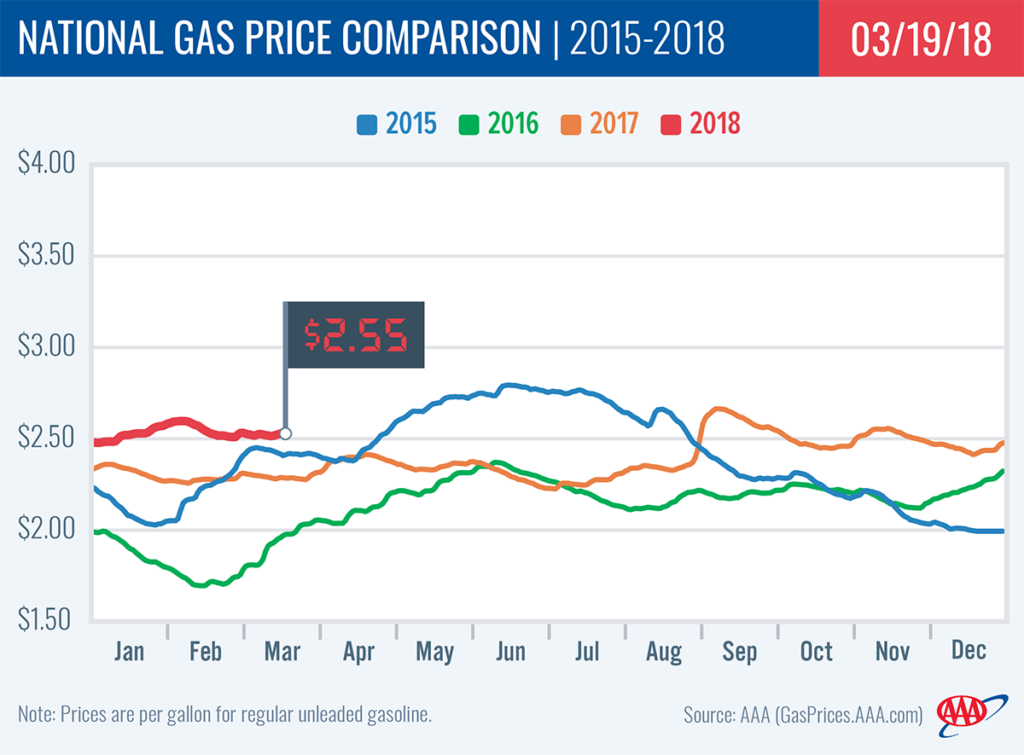
Today’s national gas price average of $2.55 is two cents more than a month ago and more than a quarter (26 cents) higher than this time last year.
Quick Stats
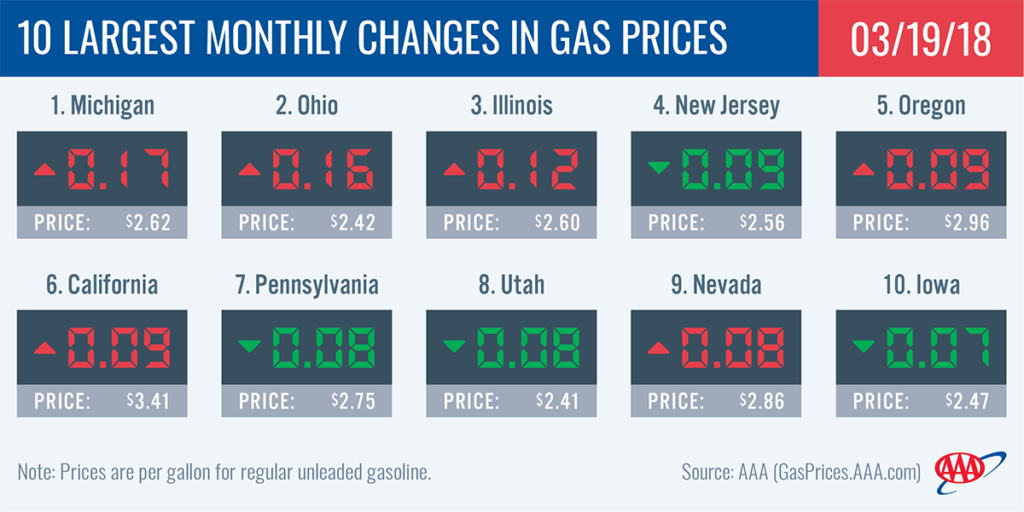
- The largest monthly changes are: Michigan (+17 cents), Ohio (+16 cents), Illinois (+12 cents), New Jersey (-9 cents), Oregon (+9 cents), California (+9 cents), Pennsylvania (-8 cents), Utah (-8 cents) Nevada (+8 cents), and Iowa (-7 cents).
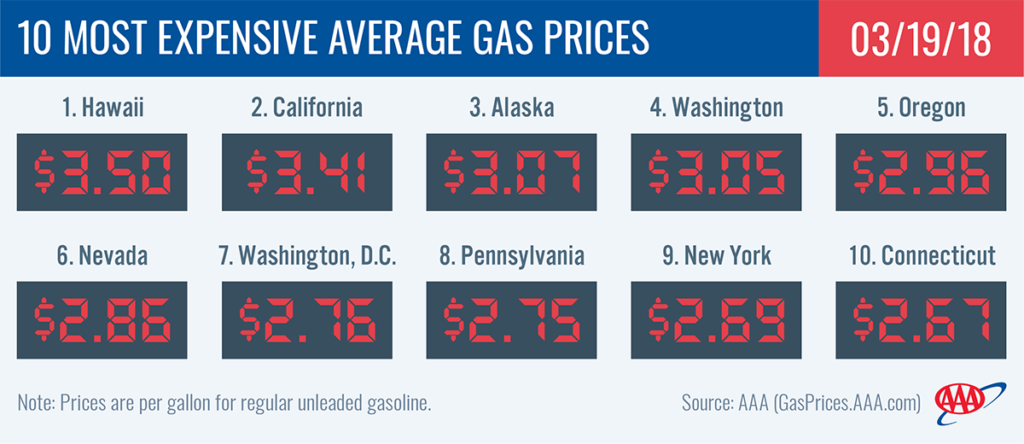
- The nation’s top ten most expensive markets are: Hawaii ($3.50), California ($3.41), Alaska ($3.07), Washington ($3.05), Oregon ($2.96), Nevada ($2.86), Washington, D.C. ($2.76), Pennsylvania ($2.75), New York ($2.69) and Connecticut ($2.67).
West Coast
Drivers in the West Coast region are paying the highest pump prices in the country. The top six most expensive markets in the country are in the region: Hawaii ($3.50), California ($3.41), Alaska ($3.07), Washington ($3.05), Oregon ($2.96) and Nevada ($2.86). On the week, most West Coast states saw an increase in prices at the pump, with Nevada (+6 cents) seeing the largest. Oregon, Washington, and California each jumped up four cents, while Alaska inched up by a penny. Only Hawaii saw no change in its average price for unleaded regular gasoline.
According to the EIA’s latest weekly petroleum report, gasoline inventories in the region saw a 2.1 million bbl draw last week – a major decline ahead of the spring driving season. Total gasoline stocks in the region sit at 32.4 million bbl, which is approximately 3.4 million bbl more than the level at this time last year.
Great Lakes and Central
In the Great Lakes and Central region, gas prices range from as cheap as $2.27 in Missouri to as expensive as $2.57 in North Dakota. On the week, pump prices are mostly more expensive with Kentucky (+9 cents), Illinois (+6 cents), Michigan (+4 cents) and Indiana (+3 cents) seeing the largest increases in the region. South Dakota (-2 cents), Nebraska (-1 cent), Minnesota (-1 cent) and Missouri (-1 cent) saw the largest decreases in the region. The 11-cents gap between gas price increases and decreases is not surprising as the region traditionally sees high volatility from week to week.
Gasoline inventories dropped by a small 817,000 bbl on the week, but measure at a strong 60 million bbl. Overall, inventory levels in the region are in line with levels this time last year, according to EIA data.
South and Southeast
Motorists are paying more to fill-up on the week in the South and Southeast. Georgia (+6 cents), Texas (+4 cents) and Florida (+4 cents) saw the largest increases in the region. Georgia’s week-over-week increase lands the state on the top 10 states list with the biggest jump in the country.
Despite the increases, the region continues to see some of the cheapest gas in the country. Mississippi ($2.28), Alabama ($2.28), South Carolina ($2.29), Arkansas ($2.30), Texas ($2.31), Louisiana ($2.32) and Oklahoma ($2.34) are among the top 10 states with the least expensive gas prices in the country.
Gasoline inventories dropped on the week yet remain above the 85 million bbl mark. Offline for planned maintenance the past month, Motiva’s Port Arthur, Texas, refinery has brought a processing units back online, which will likely contribute to an increase in inventory in coming weeks.
Mid-Atlantic and Northeast
Gas prices are volatile in the Mid-Atlantic and Northeast region. On the week, prices pushed as much as a nickel more expensive in Maryland while decreasing by a penny in Pennsylvania, New Jersey, Connecticut, Vermont, New York and New Hampshire. Three states saw prices remain stable the past seven days: Maine, Massachusetts and Rhode Island.
Motorists in Washington, D.C. ($2.76), Pennsylvania ($2.75), New York ($2.69) and Connecticut ($2.68) are paying the most expensive gas prices in the region. These four states are also among the top 10 most expensive states in the country this week.
With a 2.4 million bbl decline, the Mid-Atlantic and Northeast region saw the largest draw in the country on the week, according to EIA data. Gasoline inventories now sit at their lowest level of the year at 59.4 million bbl.
Rockies
On the week, Idaho (+2 cents), Colorado (+2 cents) and Utah (+1 cent) saw prices increase. Meanwhile, prices are cheaper in two states: Wyoming (-2 cents) and Montana (-1 cent). At $2.58, Montana carries the most expensive state gas price average in the Rockies region, which is 22-cents more expensive than this time last year.
A fire last week at Holly Frontier’s 41,400 b/d Wood Cross refinery, north of Salt Lake City, Utah, will reduce production rates as a crude unit is shut down for potentially two months. The reduced runs will have an impact on regional inventories and likely impact gas prices this spring. Besides HollyFrontier, there are four other refineries in Utah.
Gasoline inventories continue to register above 8 million bbl, despite a small draw on the week. Levels may tighten in coming weeks with the reduction at Wood Cross refinery; however, inventories are at a healthy level and analysts don’t expect a shortage in the market. Had the reduction happened during the summer, when inventory is tight, it may have had an adverse effect.
Oil market dynamics
At the close of Friday’s formal trading session on the NYMEX, WTI increased $1.15 to settle at $62.34. Crude prices rallied last week after the International Energy Agency’s (IEA) latest monthly oil market report showed that global crude demand is expected to increase to 99.3 million b/d, an increase of 1.5 million b/d over 2017’s rate of 97.8 million b/d. The report also noted that global supply reached 97.9 million b/d last month, which was fueled by growth in domestic production in the U.S. The figure is 700,000 b/d higher than last year’s rate at this time. These findings gave the market some hope that although crude production is booming in the U.S., the newly produced oil will help meet global demand instead of helping global inventories grow.
The latest weekly U.S. crude production rate record – 10.4 million b/d – was set last week, according to EIA. That rate is likely to continue growing, supported by growth in the number of active oil rigs in the country. Last week, Baker Hughes reported an increase of four rigs. The total is now 800, which is 169 more than last year at this time.
Motorists can find current gas prices along their route with the free AAA Mobile app for iPhone, iPad and Android. The app can also be used to map a route, find discounts, book a hotel and access AAA roadside assistance. Learn more at AAA.com/mobile.


