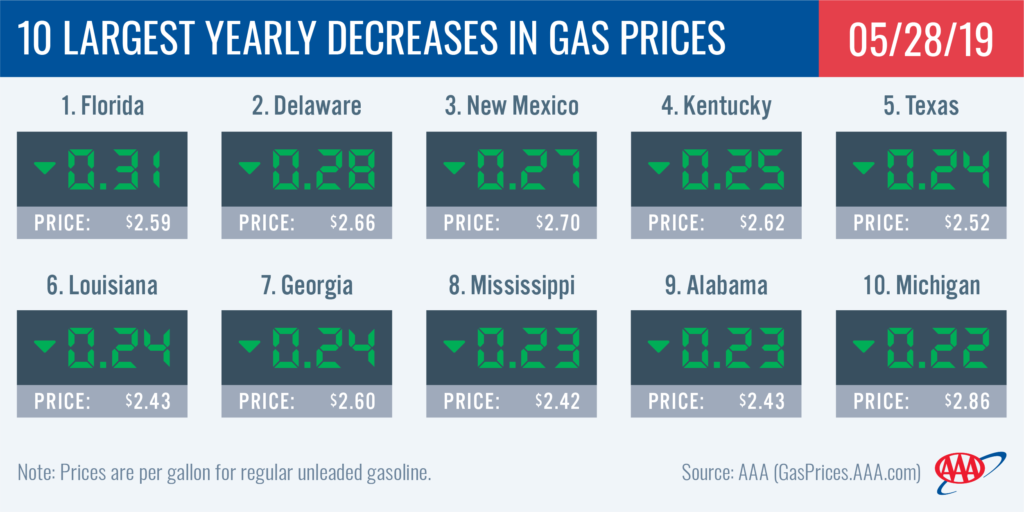
For the 37.6 million Americans who hit the road this past Memorial Day weekend, the vast majority found savings at the pump compared to last year’s holiday. Today, 42 states and Washington, D.C. have gas price averages that are less expensive year-over-year, with Floridians (-31 cents) seeing the largest yearly change. Motorists in West Coast states are the exception, paying nearly double-digits more than last May to fill up.
“Gas prices have declined, on average, by at least a nickel, for the majority of the country since the beginning of May and that’s a trend motorists can expect to continue into early June,” said Jeanette Casselano, AAA spokesperson. “Stable crude oil prices are helping to push prices down at the pump despite tight domestic gasoline supply and robust demand. A bump in demand could push prices higher, but only by a few cents.”
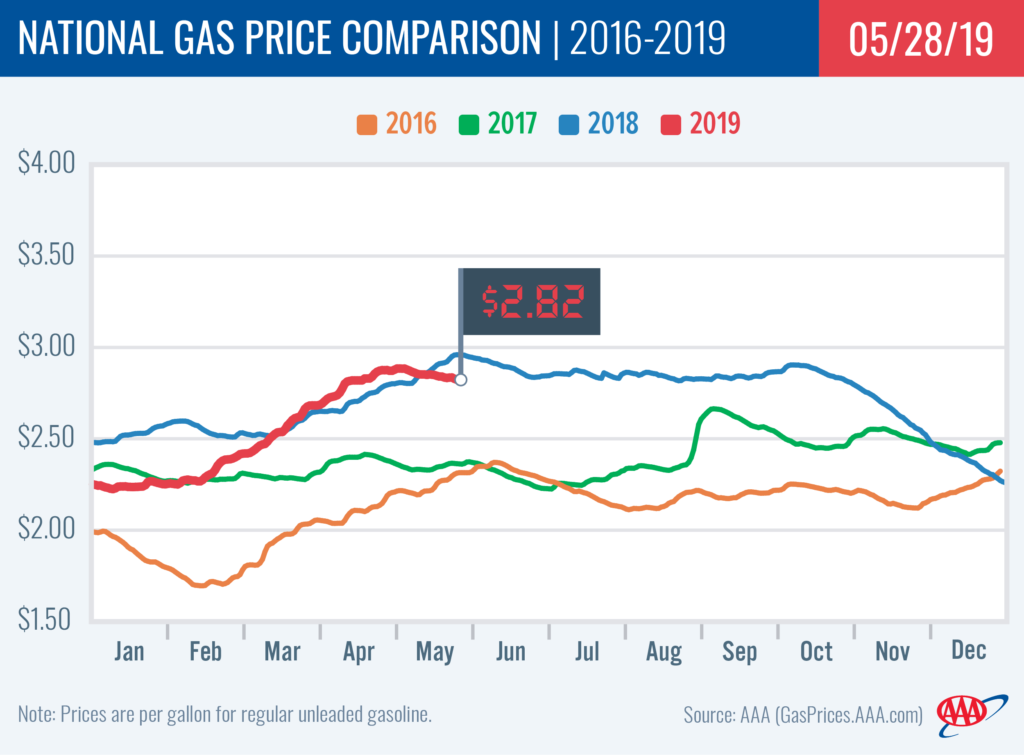
Today’s national average is $2.82, which is cheaper than last week by two cents, last month by six cents and last year by 16 cents.

Quick Stats
- The nation’s top 10 yearly decreases are: Florida (-31 cents), Delaware (-28 cents), New Mexico (-27 cents), Kentucky (-25 cents), Texas (-24 cents), Louisiana (-24 cents), Georgia (-24 cents), Mississippi (-23 cents), Alabama (-23 cents) and Michigan (-22 cents).
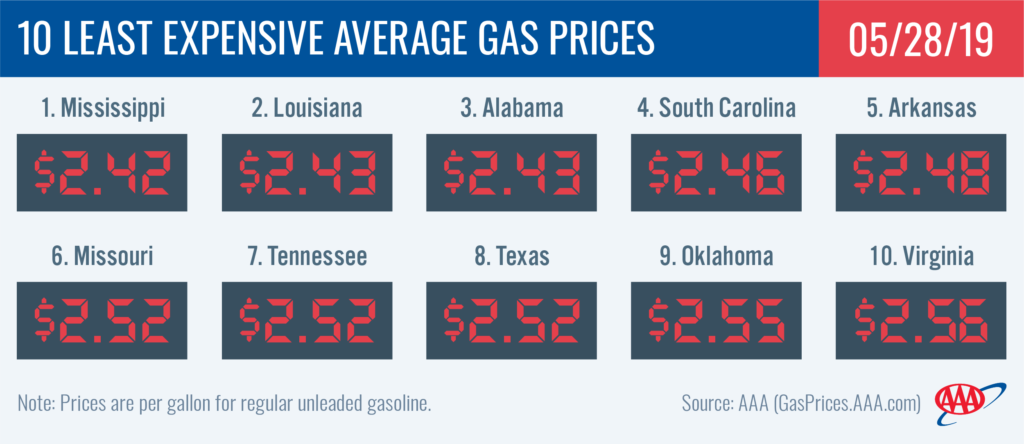
- The nation’s top 10 least expensive markets are: Mississippi ($2.42), Louisiana ($2.43), Alabama ($2.43), South Carolina ($2.46), Arkansas ($2.48), Missouri ($2.52), Tennessee ($2.52), Texas ($2.52), Oklahoma ($2.55) and Virginia ($2.56).

South and Southeast
Seven South and Southeast states make the top 10 list for largest yearly savings at the pump: Florida (-31 cents), New Mexico (-27 cents), Louisiana (-24 cents), Texas (-24 cents), Georgia (-24 cents), Mississippi (-23 cents), and Alabama (-23 cents). In the region, Oklahomans are seeing the smallest year-over-year gas price change at -14 cents.
On the week, gas prices are cheaper across the region. South Carolina was the outlier again, seeing a one cent jump since last week. State gas price averages range from $2.60 in Georgia to $2.42 in Mississippi.
With a build of 514,000 bbl, stocks are at their highest level – 83 million bbl – for the region in two months. The Energy Information Administration (EIA) report for the week ending May 17 shows refinery utilization holding steady at the 94% level. Steady utilization and increasing stocks are helping to push prices cheaper for motorists in the region.
Great Lakes and Central States
At a penny, Michigan and Indiana saw the only gas pump jumps on the week in the Great Lakes and Central States. Ohio (-7 cents), Nebraska (-4 cents), Kentucky (-3 cents) and Missouri (-2 cents) saw the largest declines at the pump with the remaining states’ averages declining a penny or holding steady on the week.
Regional stocks declined by 2 million bbl, per the EIA’s latest data, to drop levels to 47.3 million bbl. A large draw like this, especially amid very tight gasoline stock levels, may push gas prices more expensive in the coming days and weeks ahead. Year-over-year, regional stocks sit at a 5.2 million bbl deficit.
Mid-Atlantic and Northeast
Gas prices continue to trend cheaper across the Mid-Atlantic and Northeast states, with all averages now under $3/gallon. Though, at $2.98 Pennsylvania ranks as the tenth most expensive state in the country and the most expensive in the region. On the week, declines were modest. North Carolina, Washington, D.C. and Maryland saw the largest declines in the region at three cents.
Year-over-year, Delaware (-28 cents) carries the largest change in the region followed by Maryland (-22 cents), Tennessee (-20 cents) and North Carolina (-20 cents).
EIA’s latest data shows the region saw a significant build in stocks – 3.8 million bbl – to total 63.7 million. The increase was much needed and helped cut the year-over-year deficit in half, now only sitting at 1.6 million bbl less than this time last year. To keep gas prices decreasing and/or stable, stocks will need to continue to build.

Rockies
With a two-cent increase, Wyoming saw the largest weekly jump at the pump in both the region and the country. Montana saw prices increase as well, but only by a penny. For the first time in more than a month, Utah (-2 cent) saw gas prices decrease while Idaho’s ($3.20) remained stable on the week.
While motorists in the region are seeing small jumps and declines, compared to a month ago, pump prices are more expensive for the majority: Utah (+24 cents), Idaho (+19 cents), Wyoming (+11 cents), Colorado (+9 cents) and Montana (+5 cents).
At 6.4 million bbl, gasoline stocks in the region increased by just 100,000 bbl, which is the first build seen in a few weeks, according to EIA data. The bump, though very minimal, helped to keep gas prices mostly stable on the week.
West Coast
Motorists in the West Coast region are paying the highest pump prices in the nation, with all seven states landing on the nation’s top 10 most expensive list today. California ($3.99) and Hawaii ($3.64) are the most expensive markets. Washington ($3.53), Nevada ($3.47), Alaska ($3.48), Oregon ($3.42) and Arizona ($3.13) follow. Prices in the region have seen mostly modest decreases on the week, with Alaska (+2 cents) seeing the largest jump and California (-4 cents) seeing the largest decline.
The EIA’s recent weekly report for the week ending on May 17 showed that West Coast gasoline stocks grew significantly by 1.3 million bbl from the previous week and now sit at 27.7 million bbl. The current level is 2.5 million bbl less than last year’s level at this time. The West Coast may see continued price volatility, as a result of tight stocks in the region, increasing pump prices for motorists in the region.
Oil market dynamics
At the close of Friday’s formal trading session on the NYMEX, WTI increased by 72 cents to settle at $58.63. Overall, crude prices saw a loss last week, following release of EIA’s weekly petroleum status report that showed total domestic crude inventories rose by 4.8 million bbl. At 476.8 million bbl, the current level is the highest since July 2017. Ample crude supplies and increased production, which hit a record high of 12.2 million b/d last week, has increased market expectations that supply tightening due to OPEC’s production reduction agreement and reduced crude exports from Iran and Venezuela may be overcome by increased export prowess as a result of the nation’s growing domestic crude supply. Market observers will await OPEC’s meeting on June 25 and 26 in Vienna, where the cartel will likely decide to extend the agreement it has in place with its partners for the remainder of 2019, to determine how much global crude supplies may tighten further.
Motorists can find current gas prices along their route with the free AAA Mobile app for iPhone, iPad and Android. The app can also be used to map a route, find discounts, book a hotel and access AAA roadside assistance. Learn more at AAA.com/mobile.
