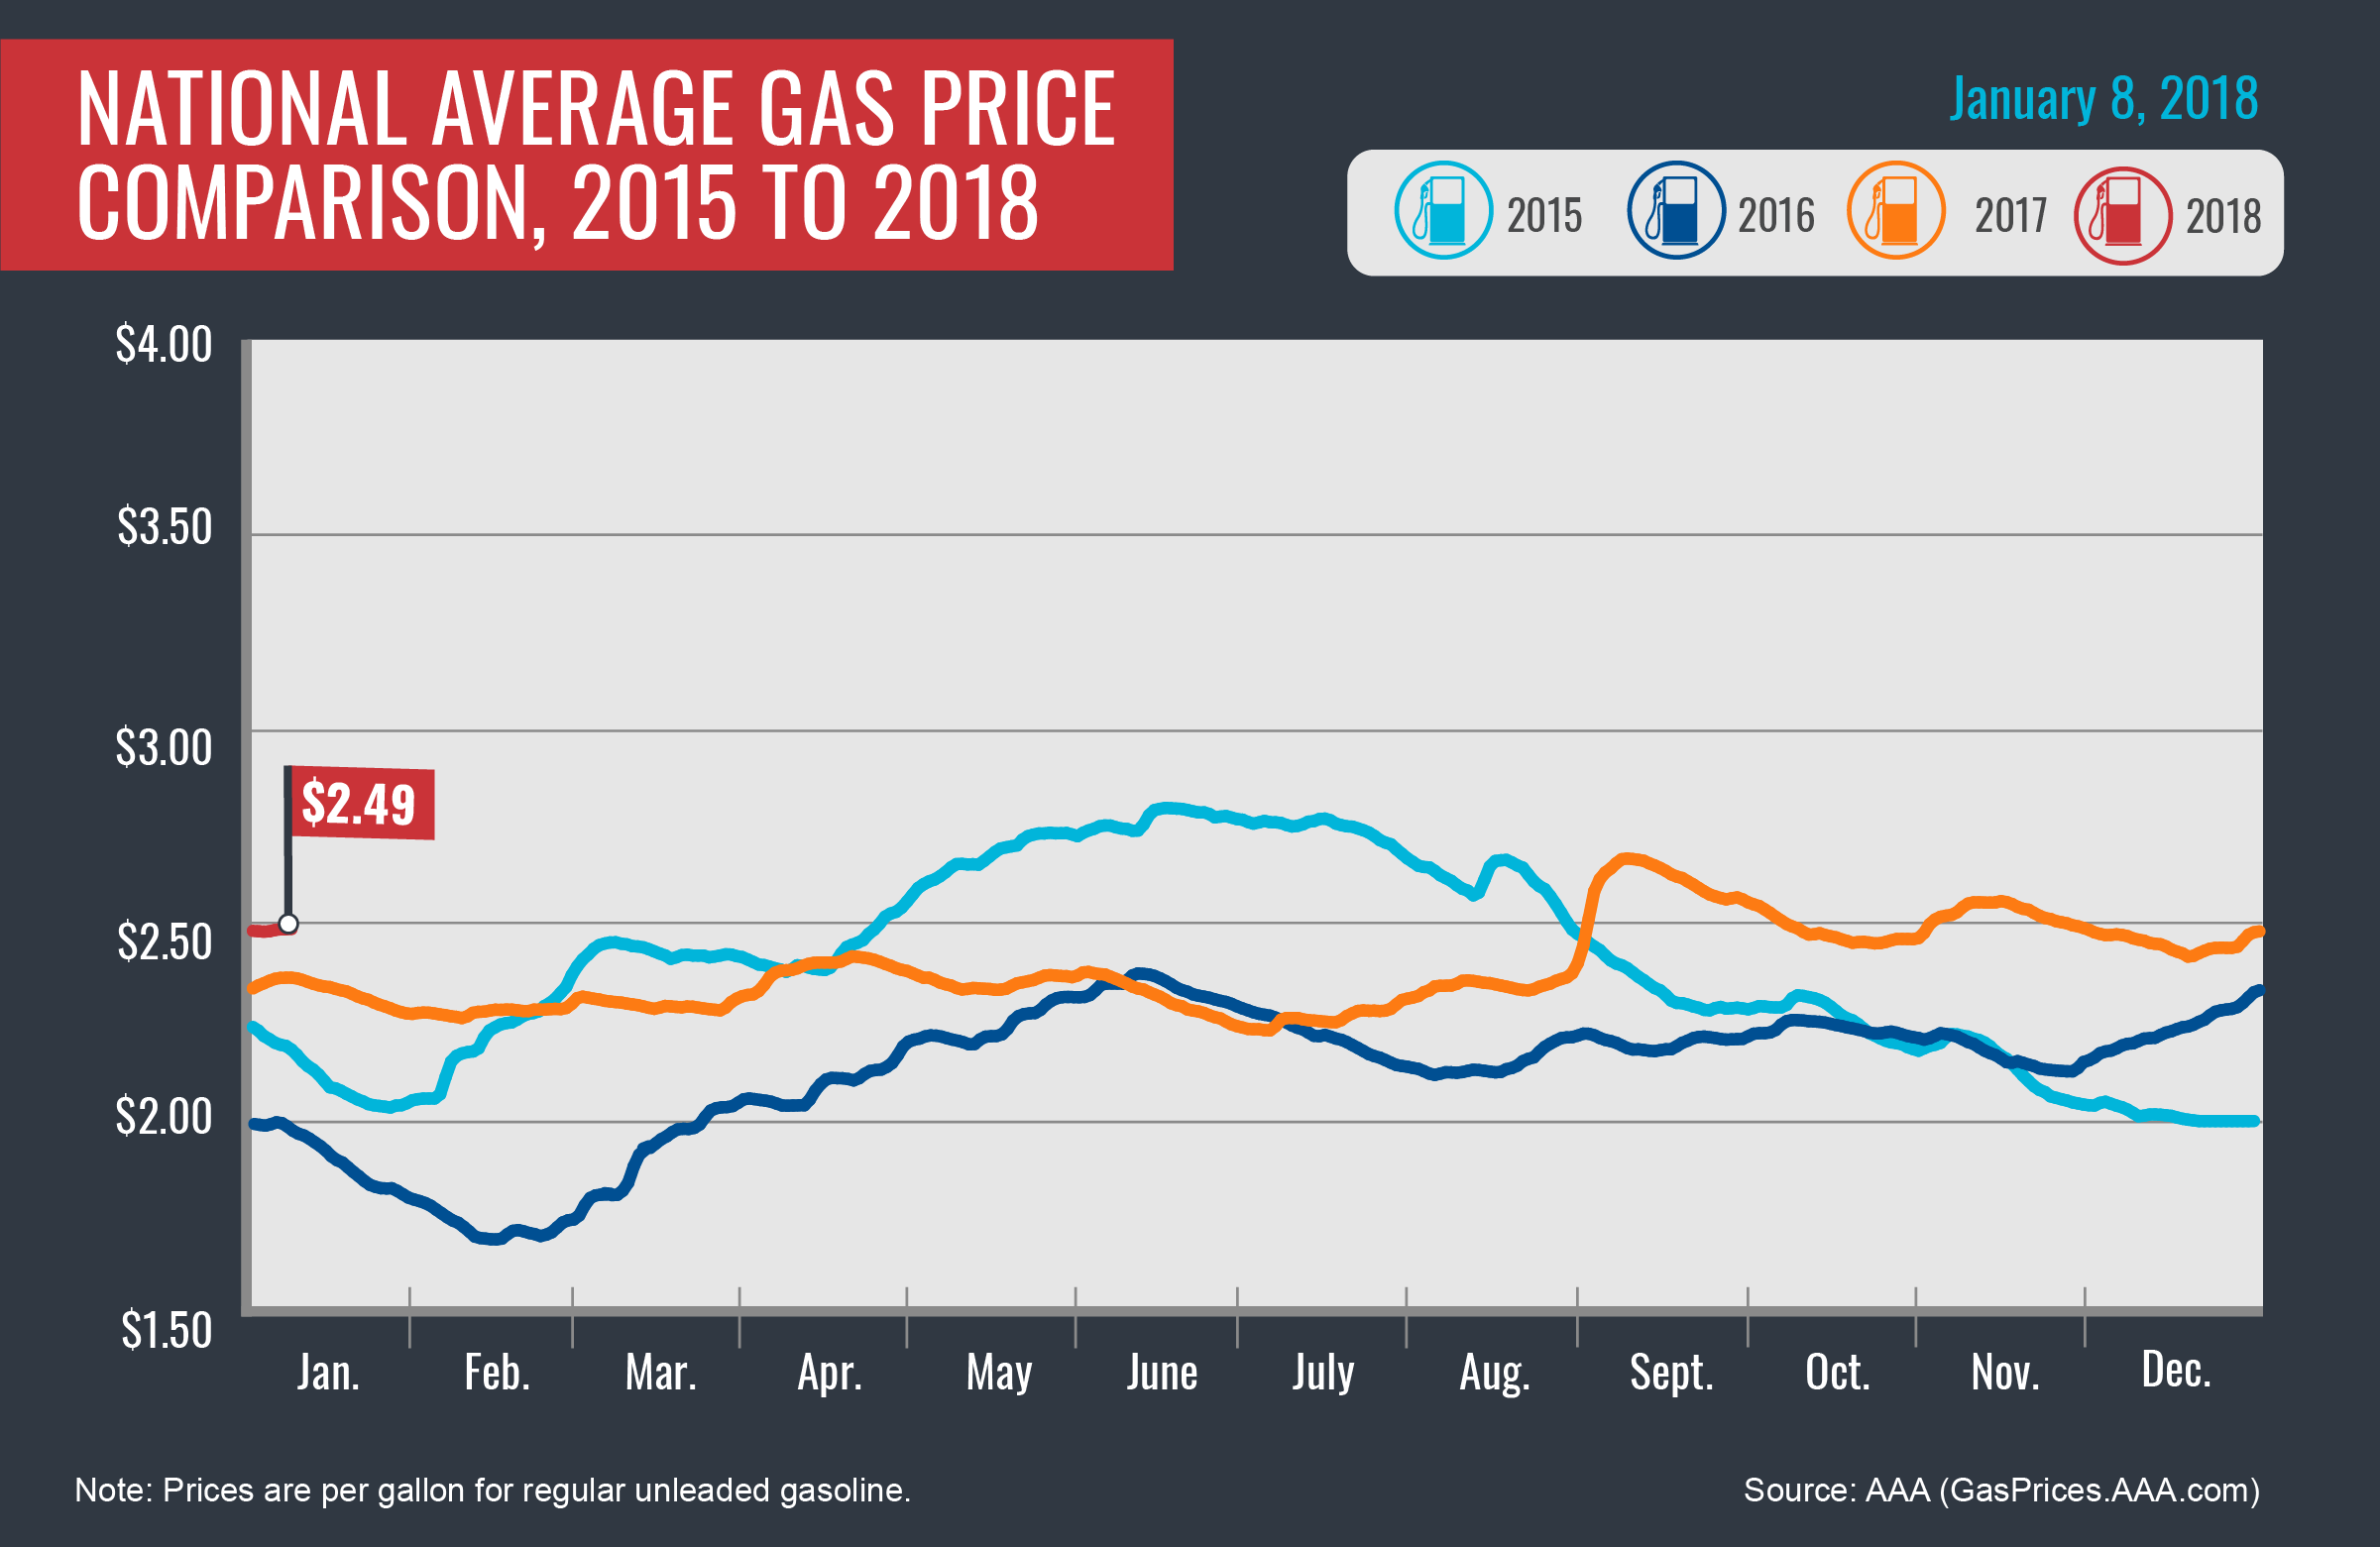
The national gas price average has held steady at $2.49 for nine straight days. Many motorists across the country are seeing more expensive gas prices at most six cents on the week, while prices are cheaper for a select few states: Indiana (-10 cents), Ohio (-7 cents), Michigan (-6 cents), Kentucky (-4 cents), Illinois (-2 cents), Colorado (-1 cent), Montana (-1 cent), New Mexico (-1 cent) and Washington, D.C. (-1 cent).
“On average, gas prices are 12 cents more expensive than a year ago. However, on the week consumer demand for gasoline decreased. If this continues, gas prices will decrease in the weeks ahead,” said Jeanette Casselano, AAA spokesperson.
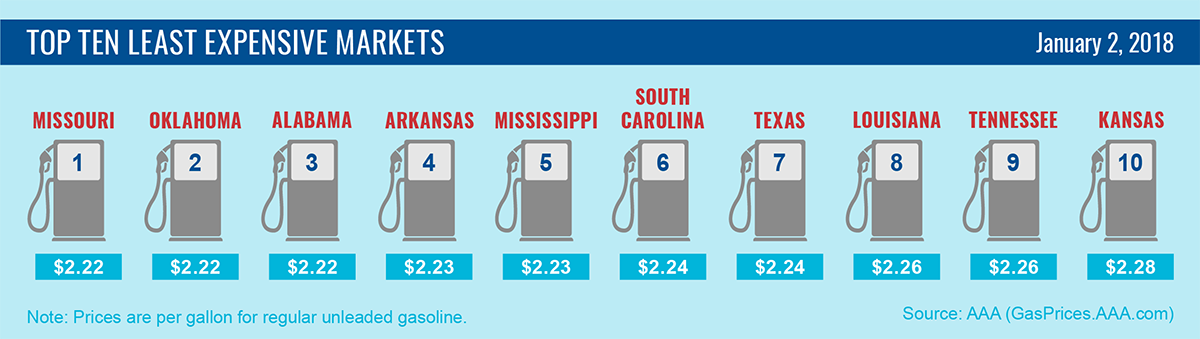
Motorists can find gas for $2.50 or less at 64 percent of gas stations nationwide. The cheapest gas can be found in Missouri ($2.23).
Quick Stats
- The nation’s top ten states with the largest monthly changes are: Alaska (-13 cents), New Mexico (-11 cents), Colorado (-10 cents), Illinois (+9 cents), Delaware (+9 cents), Idaho (-9 cents), Michigan (+9 cents), Utah (-8 cents), Wyoming (-8 cents) and Maryland (+7 cents).
- The nation’s top ten states with least expensive gasoline are: Missouri ($2.23), Arkansas ($2.24), Oklahoma ($2.25), South Carolina ($2.25), Alabama ($2.25), Texas ($2.25), Mississippi ($2.26), Louisiana ($2.27), Tennessee ($2.28) and Kansas ($2.28).
West Coast
Drivers in the West Coast region continue to pay some of the highest prices in the country. Six of the most expensive markets in the country are found in the region: Hawaii ($3.30), California ($3.16), Alaska ($3.10), Washington ($2.92), Oregon ($2.80) and Nevada ($2.67). On the week, California (+6 cents) saw the country and the region’s largest increase.
The Energy Information Administration’s (EIA) latest petroleum status report (for the week ending on December 29) found that gasoline inventories measure near a 2-year high at 32.9 million bbl. Healthy refining output rates and increased gasoline imports are contributing to the high inventory volume, which has helped to keep prices in the region mostly stable on the week.
Great Lakes and Central
Pump prices are volatile across the Great Lakes and Central states with prices increasing as much as six cents and decreasing as much as three cents on the week. Motorists in Indiana (-10 cents), Ohio (-7 cents), Michigan (-6 cents), Kentucky (-4 cents) and Illinois (-2 cents) are the only ones in the region with reprieve at the pump. Despite the ten-cent drop in price, Michigan ($2.63) continues to sell the most expensive gas in the region and is ranked 11th in the states with the most expensive gas prices.
Illinois and Michigan lead the country in the largest month-over-month change in pump price with a nine-cent increase compared to early December. Also seeing large jumps on the month: Wisconsin (+7 cents), Ohio (+5 cents), Kentucky (+4 cents) and Indiana (+2 cents).
Gasoline inventory increased alongside gas prices. The region added 2.7 million bbl. on the week, bringing the latest measurement total to 50.8 million bbl. According to the EIA, this is the largest one-week increase and highest supply levels the region has seen since end of September 2017.
South and Southeast
Motorists in every state except New Mexico are seeing more expensive gas prices on the week, with Alabama (+3 cents) seeing the largest increase. Prices have been increasing since before the holidays, yet still rank among the cheapest in the country with every state under $2.50: Arkansas ($2.24), Oklahoma ($2.25), South Carolina ($2.25), Alabama ($2.25), Texas ($2.25), Mississippi ($2.26), Louisiana ($2.27), New Mexico ($2.34), Georgia ($2.36) and Florida ($2.45).
Compared to one month ago, motorist in the South and Southeast are paying anywhere from four cents more to a one cent less at the pump, with the exception of New Mexico (-11 cents).
Gasoline inventories decreased slightly (199,000 bbl.) and sit just above the 84 million bbl. (for week-ending Dec 29). EIA data cites the regional inventory total as the highest year-end inventory measurements on record for the region.
Mid-Atlantic and Northeast
Gas prices are increasing by the day in the Mid-Atlantic and Northeast. On the week, price jumps range from six to one cent. Vermont (+5 cents) saw the largest jump in the region and the country. Washington, D.C. was the only state in the region to see prices decrease, albeit by one cent.
Similar to this time last year, four states have among the top 10 most expensive gas price averages in the country. In fact, gas prices in these states are as much as 17 cents more expensive at the start of 2018: Connecticut (+17 cents), Washington, D.C. (+12 cents), New York (+12 cents) and Pennsylvania (+11 cents).
Despite artic temperatures and violent winter weather, there have been no real supply issues in the region since gasoline inventories are ample. With a small build (55,000 bbl.), gasoline inventory levels continue to top 58 million bbl. However, the region is at a 7 million bbl. deficit compared to this time last year.
Rockies
Motorists in the region are seeing small fluctuations on the week: Utah (+2 cents), Idaho (+1 cent), Colorado (-1 cent) and Montana (-1 cent). Wyoming’s state average remained stable at $2.43.
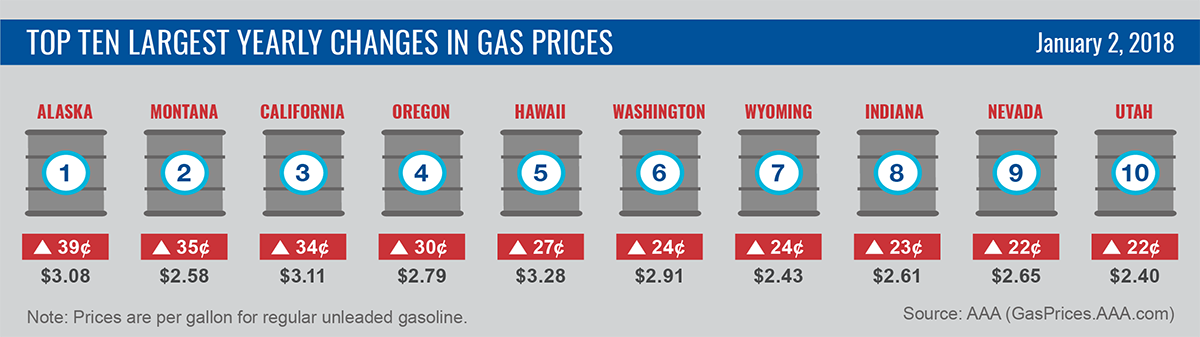
All states in the region are paying more at the pump compared to this time last year: Montana (+31 cents), Utah (-+23 cents), Idaho (+21 cents), Wyoming (+21 cents) and Colorado (+13 cents).
After two weeks of draws, gasoline inventories built by 82,000 bbl. to keep the total inventory above 7 million bbl.
Oil market dynamics
At the close of Friday’s formal trading session on the NYMEX, WTI decreased 57 cents to settle at $61.44.
Although the market dropped slightly last week, end of the year gains were significant according to the EIA. Among the 2017 U.S. crude highlights were:
- Crude oil prices at the end of the year were the highest year-end prices since 2013;
- U.S. crude production increased by more than 384,000 b/d to 9.2 million b/d (based on confirmed data through September 2017); and
- Crude oil exports averaged 1 million b/d through October 2017 – a record high and increase of 445,000 b/d from the 2016 average.
These facts have given the market greater optimism about the potential of prices continuing to climb in 2018, as OPEC’s agreement to reduce production will remain in effect through the end of this year and will help to restrain growing inventories. However, growing U.S. production amid higher global demand growth has given some pause to these optimistic market observations. U.S. production rates in coming months will give a clearer picture. The latest weekly active rig count report from Baker Hughes, Inc. found the U.S. dropped by five rigs to land at 742.
Motorists can find current gas prices along their route with the free AAA Mobile app for iPhone, iPad and Android. The app can also be used to map a route, find discounts, book a hotel and access AAA roadside assistance. Learn more at AAA.com/mobile.