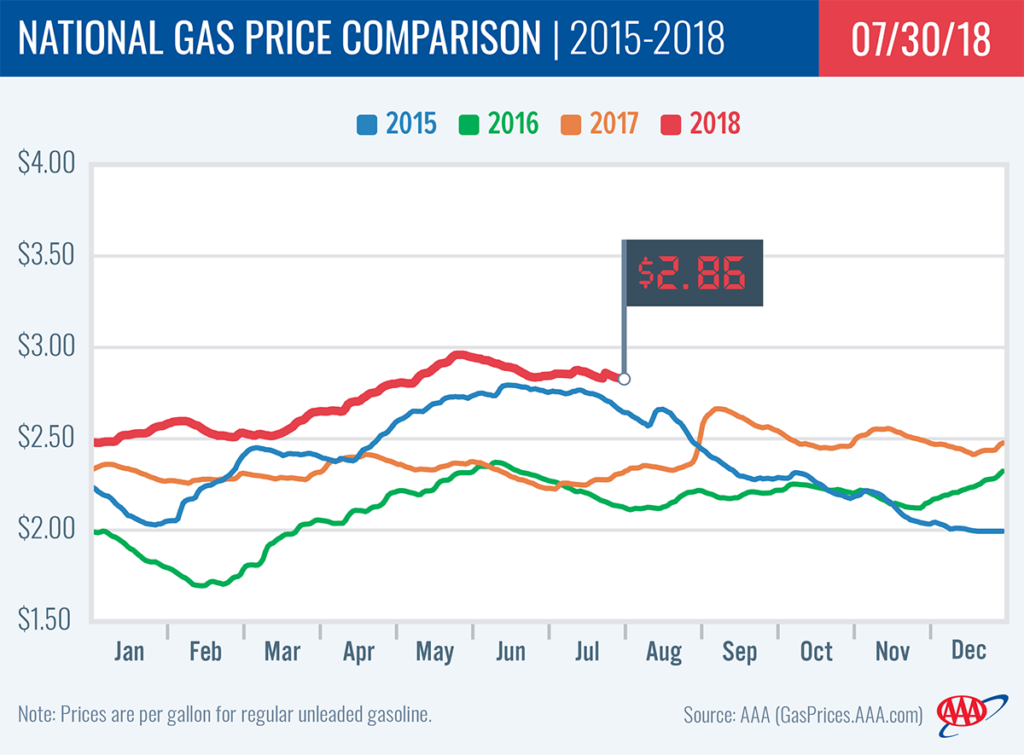
As U.S. gasoline demand strengthened and supply declined, the national gas price average jumped two-cents on the week to land at $2.86. According to the latest Energy Information Administration (EIA) report, total crude inventories fell on the week and now register at 405 million bbl, which is 80 million bbl lower than levels at the same time last year.
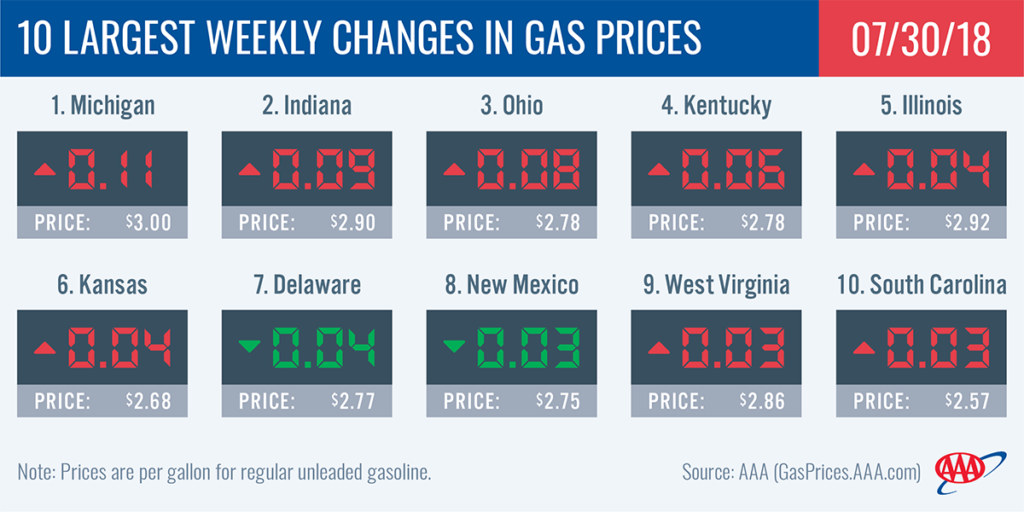
“As crude and gasoline inventories tighten, motorists can expect gas prices to trend higher and remain volatile,” said Jeanette Casselano, AAA spokesperson. “On the week, pump prices increased as much as 11-cents for some states with others seeing decreases of up to four-cents.”
While today’s gas price average is one-cent less than last month, it is 55-cents more than a year ago and crude oil prices are up $20/bbl compared to this time last year.
Quick Stats
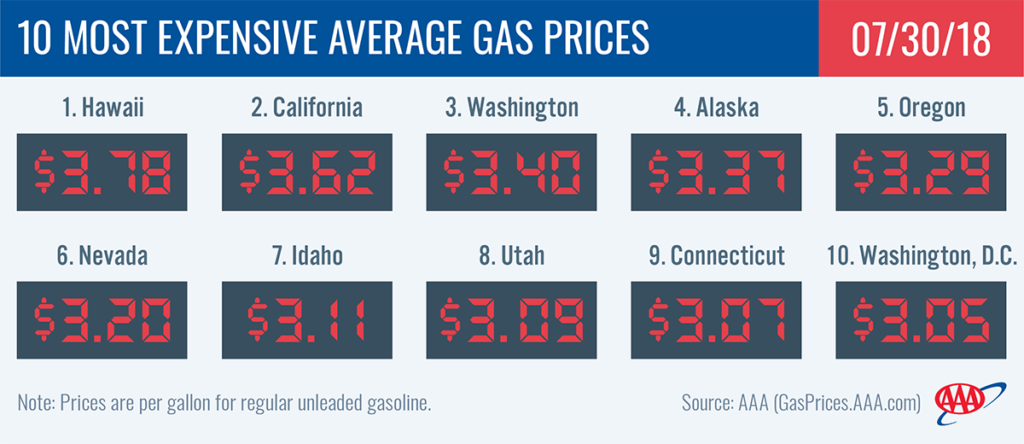
- The nation’s top 10 most expensive markets are: Hawaii($3.78), California ($3.62), Washington ($3.40), Alaska ($3.37), Oregon ($3.29), Nevada ($3.20), Idaho ($3.11), Utah ($3.09), Connecticut ($3.07) and Washington, D.C. ($3.05).
- The nation’s top 10 largest weekly changes are: Michigan (+11 cents), Indiana (+9 cents), Ohio (+8 cents), Kentucky (+6 cents), Illinois (+4 cents), Kansas (+4 cents), Delaware (-4 cents), New Mexico (-3 cents), West Virginia (+3 cents) and South Carolina (+3 cents).
West Coast
Pump prices in states in the West Coast region are among the highest in the country: Hawaii ($3.78), California ($3.62), Washington ($3.40), Alaska ($3.3), Oregon (3.29), Nevada ($3.20) and Arizona ($2.92). Yet on the week, all gas prices in the region are down. Arizona (-2 cents) saw the largest decrease. Washington, Nevada, and Alaska are close behind as each dropped by a penny.
According to EIA’s petroleum status report for the week ending on July 20, inventories of gasoline in the region grew by 300,000 bbl. They now sit at 30.6 million bbl, which is nearly 3.5 million bbl higher than total levels at this time last year. The surplus will likely help guard against price spikes in the event that supply tightens in the region this week.
Great Lakes and Central
The seven Great Lakes and Central states that saw large declines last week are seeing higher pump prices this week. In fact, Michigan’s decreases from last week were reversed with motorists seeing an 11-cent jump, bringing the state’s average to the $3 mark for the first time since July 15.
| State | July 23 Difference in Price from Week Prior | July 30 Difference in Price From Week Prior |
July 30 State Gas Price Average |
|---|---|---|---|
| Ohio | -13 cents | +8 cents | $2.78 |
| Michigan | -11 cents | +11 cents | $3.00 |
| Indiana | -11 cents | +9 cents | $2.90 |
| Kentucky | -8 cents | +4 cents | $2.78 |
| Illinois | -7 cents | +4 cents | $2.92 |
| Missouri | -5 cents | +2 cents | $2.63 |
| Nebraska | -4 cents | +2 cents | $2.73 |
While no states in the region saw prices decrease on the week, North Dakota ($2.85) was the one to see the state gas price average hold steady.
Gasoline inventories in the region declined for a third week. With the drop, total inventories are at the lowest mark of the year at 51.6 million bbl, a 1.2-million bbl year-over-year deficit. If inventories continue to tighten, motorists in the region can expect gas prices to climb.
South and Southeast
Pump prices are more expensive for all states across the South and Southeast except in New Mexico (-3 cents) and Florida (-1 cent). The largest pump price increase on the week was three-cents in South Carolina ($2.57) and Texas ($2.64).
Compared to one month ago, the majority of states in the region are paying more to fill up, with South Carolina seeing the largest month-over-month increase at five-cents. Motorists in New Mexico (-13 cents) and Texas (-1 cent) are the only states to see a drop in gas prices on the month.
Inventories dropped by 900,000 bbl on the week, but remain above the 79 million bbl mark. More so, the region faces a substantial 2.6 million bbl year-over-year deficit. The week’s draw combined with the deficit is contributing to the increasing pump prices across the region.
Mid-Atlantic and Northeast
Gas prices are volatile across the Mid-Atlantic and Northeast region. This week’s top 10 states in the country with the biggest changes in gas prices include Delaware (-4 cents) and West Virginia (+3 cents). However, most states in the region saw gas prices hold steady on the week: Virginia ($2.61), Tennessee ($2.61), North Carolina ($2.67), New Hampshire ($2.80), Vermont ($2.90), New York ($3.00) and Connecticut ($3.07).
Four states in the region carry gas prices that are $3 or more: Connecticut ($3.07), Washington, D.C. ($3.05), Pennsylvania ($3.04) and New York ($3.00).
With a nearly one million bbl decline, the Mid-Atlantic and Northeast region saw the largest drop in gasoline inventories in the country on the week, according to EIA data. At 65.2 million bbl, the region has a 3 million bbl inventory surplus compared to last year at this time, which could continue to help stabilize gas prices in the region.
Rockies
In the Rockies region, all states’ gas price averages decreased or held steady on the week: Utah (-2 cents), Colorado (-2 cents), Wyoming (-2 cent), Idaho (-1 cent) and Montana (no change). Despite the positive shifts in gas prices lately, Idaho ($3.11), Utah ($3.09), Wyoming ($2.94) and Montana ($2.94) carry among the top 15 most expensive gas prices in the country.
Inventories remain above the 7million bbl mark, which is a 537,000 bbl year-over-year surplus and a contributing factor in the downward shift in gas prices.
Oil market dynamics
At the close of Friday’s formal trading session on the NYMEX, WTI decreased 92 cents to settle at $68.69. Oil prices trended higher with the release of EIA’s weekly report that total crude inventories fell by 6.2 million bbl and face a year-over-year deficit of 80 million bbl. The tightened domestic crude supply amid robust global gasoline demand and high global crude demand will likely sustain into the near future the more expensive crude oil prices, which are $20/bbl more compared to last year.
Additionally, the market will look at EIA’s supply data and July crude production data from OPEC and its partners — both of which will be released later this week — to determine how supply and demand are faring since the cartel announced that it would increase production to ease global crude price growth. Moreover, according to Baker Hughes, Inc., the U.S. added three oil rigs last week, bringing the total to 861. Currently, there are 95 more active rigs this year than last year at this time.
Motorists can find current gas prices along their route with the free AAA Mobile app for iPhone, iPad and Android. The app can also be used to map a route, find discounts, book a hotel and access AAA roadside assistance. Learn more at AAA.com/mobile.


