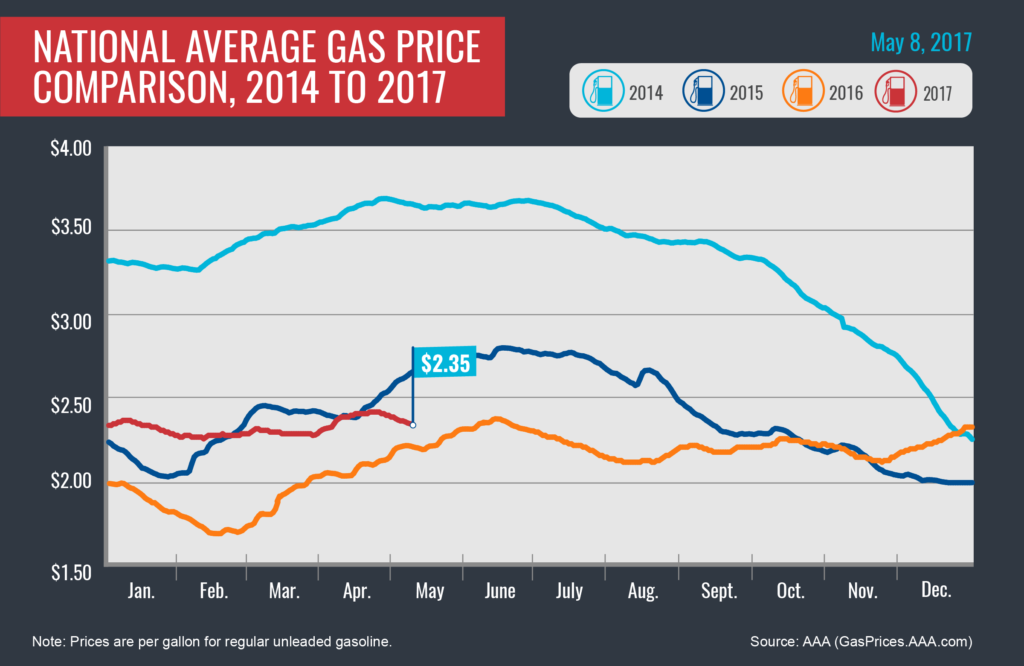
Today’s national average price for regular unleaded gasoline is $2.35 per gallon, which is four cents less than one week and one month ago, and 14 cents more than the same date last year. Last week, 46 states saw prices drop – some by at least 9 cents – with prices remaining steady in other parts of the country. The trending decline is due to an unseasonable glut of gasoline in the U.S. market, record high refinery production rates, moderate demand and a recent drop in crude oil prices.

Quick Stats
- The nation’s top ten markets with the largest weekly decreases include: Ohio (-9 cents), Michigan (-9 cents), Indiana (-9 cents), Illinois (-7 cents), Delaware (-6 cents), Kentucky (-6 cents), Missouri (-6 cents), Florida (-5 cents), Kansas (-5 cents) and Maryland (-4 cents).
- The nation’s top ten markets with the biggest changes in the last year include: Alaska (+44 cents), Hawaii (+42 cents), Washington (+40 cents), Oregon (+34 cents), New Jersey (+30 cents), New Mexico (+27 cents), Montana (+26 cents), North Dakota (+24 cents), Nevada (+21 cents) and Pennsylvania (+21 cents).

West Coast
Despite small price declines on the week, the region remains the most expensive market in the country for gasoline. The West Coast is the only region in the country where demand seems to counter oversupply. The latest Energy Information Association (EIA) report shows that regional gasoline stocks registered their largest draw in seven weeks. According to OPIS, the inventory drop indicates regional demand has increased leading into to the summer driving season and is likely to continue.
Drivers in the region have seen significant increases at the pump compared to this same time last year, with most paying on average 14 percent more for a gallon of gasoline: Alaska (+44 cents), Hawaii (+42 cents), Washington (+40 cents), Oregon (+34 cents), Nevada (+21 cents) and Arizona (+12 cents)
Rockies
Last week, Colorado ($2.33) and Utah ($2.46) saw two-cent decreases, while three states remained flat: Montana ($2.38), Wyoming ($2.33), and Idaho ($2.56). The average gas price in the region is 17 cents more expensive than this day a year ago ($2.23 vs. $2.40).
Great Lakes and Central States
The Great Lakes and Central states are seeing the biggest drops in prices this week with five regional states making the top 10 list of largest weekly declines: Ohio (-9 cents), Michigan (-9 cents), Indiana (-9 cents), Illinois (-7 cents), and Kansas (-4 cents). Two states have gas prices within pennies of May 2016 prices, including Ohio ($2.18) and Indiana ($2.17).
Historically, gasoline stocks start to fall in April, however this year the region has seen unseasonable increases in gasoline stocks, which continues to build due to low driving demand. Projections for high summer travel volume will likely cause demand to peak later this summer – July or August.
South and Southeast
Gas prices in most parts of the region dropped slightly or remained flat on the week, with the exception of Kentucky (-6 cents), Missouri (-6 cents) and Florida (-5 cents) where prices dropped by five cents or more. The region continues to lead the country as the cheapest market for retail gasoline: South Carolina ($2.06), Oklahoma ($2.07), Tennessee ($2.12), Mississippi ($2.12), Alabama ($2.12), Missouri (2.13), Arkansas ($2.13), and Louisiana ($2.15). Since January 1, 2017, South Carolina on average has had the cheapest gas in the country ($2.07).
Mid-Atlantic and Northeast
Like most parts of the country, drivers in the Mid-Atlantic and Northeast are seeing regional gasoline supplies out pace demand. Delaware (-6 cents) and Maryland (-4 cents) saw some of the country’s largest weekly declines, while Pennsylvania ($2.64), New York ($2.53) and Washington, D.C. ($2.53) held their place on the country’s top 10 list of most expensive markets. Other states saw prices remain stable or experienced small fluctuation.

Oil Market Dynamics
On Monday morning, U.S. petroleum futures were below $50 per barrel, but they have gained slightly after encouraging remarks from the Russian and Saudi Arabian energy ministers over the weekend. The energy ministers stated that there is budding consensus to extend production cuts beyond the June 30 deadline and into 2018, signaling that OPEC and non-OPEC producers are willing to take necessary steps to rebalance the market. Since the cuts were enacted, U.S. oil production has increased more than 10 percent since mid-2016 to a total of 9.3 million barrels per day and close to levels of the world’s top producers – Russia and Saudi Arabia. With some market predictions suggesting that U.S. production could soon reach 10 million barrels per day, OPEC and its partners must continue to restrict supply if their market correction goals are to be achieved. Additionally, U.S. drillers added 6 more oil rigs, bringing the total rig count to 703 and marking 16 weeks of growth, according to last week’s data from energy services firm Baker Hughes Inc. The U.S. rig count is now up a whopping 375 oil rigs when compared to last year’s count at this time. Continued increases in the supply and exploration of crude will certainly counter OPEC’s efforts to rebalance the market. Only time will tell if supply restrictions and rising demand will shorten the oversupply – and ultimately lead to higher retail prices at the pump.
Motorists can find current gas prices along their route with the free AAA Mobile app for iPhone, iPad, and Android. The app can also be used to map a route, find discounts, book a hotel, and access AAA roadside assistance. Learn more at AAA.com/mobile.
